Facts & Stats
Fall 2025
Students
Total undergraduate enrollment: 1824
Total Degree-Seeking Students: 1810
Associate Degree Students: 355
Bachelor's Degree Students: 1418
Certificate Students: 37
Student/Faculty ratio: 16:1
Average Class Size: 22
Job Placement/Enrolled in Further Education: 89% (of those responding to graduate survey – 2024 Survey Administration)
Job Placement Rate: 88% (of those responding to graduate survey – 2024 Survey Administration)
Male: 782 (43%)
Female: 1040 (57%)
Not Disclosed: 2 (<1%)
American Indian or Alaska Native: <1%
Asian or Pacific Islander: 2%
Black, non-Hispanic: 8%
Hispanic: 15%
International: <1%
Other/Unknown: 4%
Two or More: 1%
White, non-Hispanic: 70%
66% live in college-owned housing
34% live off campus or commute
Geographic Origins
Percent of Total Students from New York State: 89%
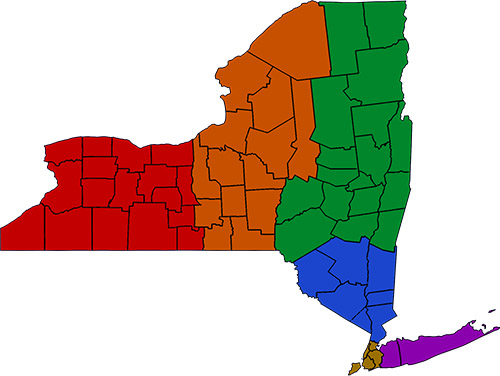
Percent of In-State Students from each region:
Capital Region: 44%
New York City: 14%
Hudson Valley: 16%
Central Region: 12%
Western Region: 9%
Long Island: 6%
New York Counties Represented: 61
States Represented: 26
-
Colorado
-
Connecticut
-
Delaware
-
Florida
-
Georgia
-
Idaho
-
Massachusetts
-
Maryland
-
Maine
-
Michigan
-
Minnesota
-
Missouri
-
North Carolina
-
Nebraska
-
New Hampshire
-
New Jersey
-
New York
-
Oregon
-
Pennsylvania
-
Rhode Island
-
South Carolina
-
Tennessee
-
Texas
-
Virginia
-
Vermont
-
Washington
Countries Represented: 4
-
People's Republic of China
-
France
-
Republic of Korea
-
United States of America
Class Profiles
2025 First Time Student Class Profile
Enrollment: 542
High School GPA: 85
2025 Transfer Class Profile
Enrollment: 146
Cost
2025-2026 In-State:
Tuition: $7,070
Fees: $1,698
Room and Board: $17,032
2025-2026 Out-of-State:
Tuition (Bachelor's degree): $17,400
Fees: $1,698
Room and Board: $17,032
Quick Facts
Quick Facts includes current fall Student Enrollment by Student Type, Dorm Residence, Full-time/Part-Time Status, Financial Aid, Race/Ethnicity, and Home Residence. Also includes outcomes (post-graduation employment, continuing education) from the Graduation Survey, Annual costs, number of faculty, class size and student to faculty ratio. Click here to view the dashboard.
Enrollment Trends
Fall Student Enrollment (over time) includes Fall Student Enrollment by Full-time/Part-Time Status, Degree (Associates, Bachelors, etc.), and Academic program.
Spring Student Enrollment (over time) includes Spring Student Enrollment by Full-time/Part-Time Status, Degree (Associates, Bachelors, etc.), and Academic program.
Transfer Out Rates (over time) includes Transfer Out rates for new First-Time Full-Time Associate-seeking students.
Retention & Graduation
Student Retention (over time) includes fall-to-fall retention from the first to second year, for new First-Time Full-Time students both overall and by initial intended Degree (Associates, Bachelors, etc.) and Academic program.
Student Graduation (over time) includes graduation rates for new First-Time Full-Time students by their initial intended Degree (Associates, Bachelors, etc.).
Student Outcomes (over time) includes completion rates for new First-Time Full-Time students, regardless of their initial intended Degree (Associates, Bachelors, etc.).
Data Archive: historic college data from 2016 to 2023
Read more Facts & Figures About SUNY Cobleskill Ag & Tech